
As evidence that builders are facing the combined headwinds of rising material and labor costs as well as supply chain delays, the pace of multifamily development is down.
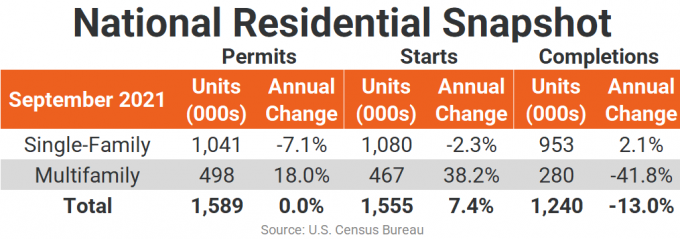
Multifamily starts slipped 5.1% to 467,000 units in September from August’s revised annual rate, while building permits fell 21% to 498,000 units, according to the U.S. Census Bureau. However, for the year, multifamily starts are up 38.2% and permits are up 18%.
As further evidence that multifamily builders are facing headwinds, the seasonally adjusted annual rate (SAAR) for multifamily completions plunged 18.1% from last month and 41.8% from last year to just 280,000 units, while at the same time the rate of units under construction edged up 1.4% to 701,000 multifamily units, its highest total since 1974.

Single-family homebuilders are facing the same industry headwinds for development with the addition of low inventory of developed lots. Single-family starts were unchanged from last month at 1.08 million units but are down 2.3% from September 2020. Building permits for single-family homes were also virtually unchanged (-0.9%) from August at 1.04 million units and were also down for the year (-7.1%). The number of single-family homes currently under construction is also elevated at 712,000 units, the most since the waning period of the housing bubble bust in 2007.
Together, total residential permits were down 7.7% from August to 1.589 million units and total residential starts were down 1.6% to 1.555 million units. Compared to one year ago, total residential permits were unchanged while total starts were up 7.4% due to the sharp increase in multifamily starts from September 2020.
The annual rate for multifamily permitting was up in three of the nation’s four Census regions, with the largest annual increase in the West (up 36.7% to 142,000 units). The Midwest’s annualized rate increased 29.8% to 79,000 units from last September while the South was up 24.6% to 223,000 units. The small Northeast region decreased 30.2% to 56,000 units. Compared to the previous month, all regions decreased, with the Northeast down 28.6% and the South and West down about 23% each. The Midwest region had a more modest decline in annual permitting from last month of 2.8%.
Regional annual multifamily starts were up significantly in the South (+72.2% to 201,000 units) and West (+64.4% to 136,000 units), while the Northeast region fell 8.4% from last year to 52,000 units started and the Midwest slipped 4.6% to 78,000 units. Compared to August’s pace, the South (-5.2%) and Northeast (-45.8%) regions declined while the Midwest (+6.8%) and West (+22.5%) had increases in multifamily starts.
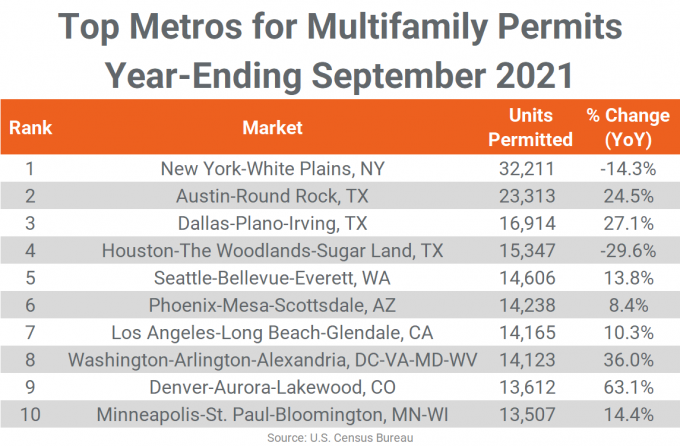
At the metro level, nine of the top 10 permitting markets in September returned to the list from August with only the first two in order and several others changing places. New York continues to lead the nation in multifamily permitting with about 32,200 units but the market’s pace is continuing to slow. Austin again ranked #2 with 23,313 units permitted, an almost one-quarter gain from last year.
Dallas replaced Houston at #3 this month with 16,914 units permitted, an increase of more than 27% from 2020’s slower pace. Houston continues to slow its multifamily permitting despite ranking at #4 this month. More than 15,300 units were permitted in the year-ending September but that was a decline of nearly one-third from last year.
Seattle returned at #5 with about 14,600 units, up about 13% from the previous year, while Phoenix jumped up two spots to #6 with 14,238 units permitted, only an 8% gain over September 2020. Los Angeles ranked #7 this month with about 14,200 units permitted in the year-ending September, up about 10% annually.
Washington, DC and Denver each inched up a spot to #8 and #9 with 14,123 and 13,612 units permitted, respectively. DC grew by 36% annually, while permits in the Mile-High City were up more than 63% from last year. Last month’s #7 – Philadelphia – dropped out of the top 10 this month, replaced by Minneapolis-St. Paul at #10 with annual multifamily permitting of 13,507 units.
Eight of the top 10 multifamily permitting markets boosted annual totals from the year before and they were generally large increases, ranging from a low of 1,107 units in Phoenix to more than 5,200 additional units in Denver. Austin’s increase of almost 4,600 units was second only to Denver and was about 1,000 units more than in Dallas and Washington, DC’s increases over last year (around 3,600 to 3,700 additional units each). The remaining top 10 with increasing permitting averaged about 1,500 additional units permitted over last year’s totals.
Other markets outside of the top 10 that saw significant year-over-year increases in annual multifamily permitting in the year-ending September were Philadelphia (+7,954 units), Jacksonville, FL (+4,028 units), Charlotte (+3,493 units), Raleigh/Durham (+3,438 units), and San Antonio (+2,240 units).
Only two of the top markets saw decreases in the year-ending September 2021. Houston permitted almost 6,500 fewer units than last year and New York’s annual permitting fell by 5,363 units. Significant slowing in annual multifamily permitting also occurred in the non-top 10 markets of Cape Coral-Fort Meyers, FL (-2,972 units), San Jose (-2,714 units), Kansas City (-1,744 units), and Bridgeport, CT (-1,180 units).
Six of the top 10 markets had more annual multifamily permits than the previous month, with Dallas jumping almost 7% from August’s annual total. Phoenix, Washington, DC, Minneapolis-St. Paul and Denver were up an average of about 5% from last month, while Los Angeles improved only about 1%. Houston fell 11.6% from last month with Austin and New York retreating close to 7% from the previous month’s annual totals. Seattle slipped only 1.4%.
The annual total of multifamily permits issued in the top 10 metros – 172,036 – was about 7% more than the 160,754 issued in the previous 12 months. The total number of permits issued in the top 10 metros was almost equal to the number of permits issued for the #11 through #35 ranked metros.
All of last month’s top 10 permit-issuing places returned to this month’s list with five remaining in the same order. The list of top individual permitting places (cities, towns, boroughs, and unincorporated counties) generally includes the principal city of some of the most active metro areas.
The city of Austin returned as the #1 permit-issuing place with 12,235 units. However, that annual total was 1,329 units less than last month’s. The city-county of Nashville-Davidson and the city of Los Angeles returned in order, permitting 11,526 units and 10,850 units, respectively.
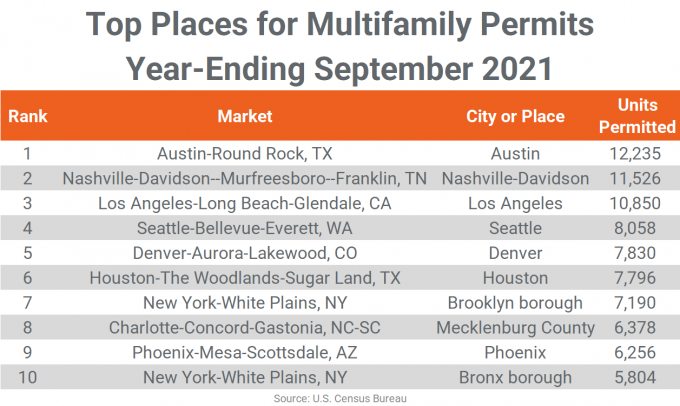
The city of Seattle replaced the city of Houston at #4 on the list with about 8,100 units permitted, a decrease of 1,039 units from August, while the cities of Denver and Houston came in at #5 and #6, permitting about 7,800 units for the year each. The borough of Brooklyn permitted almost 7,200 units for the year-ending September, ranking at #7.
Mecklenburg County (Charlotte) moved up to #8 from #10 last month with 6,378 units permitted, close to last month’s total. The city of Phoenix remained at #9 in September with almost 6,300 units permitted, while the Bronx borough slipped two spots to #10 with about 5,800 multifamily units permitted for the year.
Texas still dominates the list of permitting places with seven of the top 20 permit-issuing places, while no other state has more than two spots on the list. While the list of top markets for metro-level multifamily permitting generally saw increases over last month, only three place-level cities or counties had increased permitting from August’s annual totals.
Source: Increasing Costs and Delays Hamper Multifamily Development

Randolph is a Multifamily Investment Sales Broker with eXp Commercial servicing Multifamily Buyers and Sellers in the Greater Chicago Area.